

21대 국회의원선거 사전투표 조작의혹 관련 논란이 증폭되고 있는 가운데, 관련 분야 세계적인 권위자로 평가받고 있는 한 전문가의 문건이 공개됐다.
Walter R. Mebane, Jr.이라는 미국 미시건 대학교의 정치학과 교수가 작성한 "Frauds in the Korea 2020 Parliamentary Election" 라는 문건으로, 본지는 국민의 알권리 차원에서 문서를 입수하여 전문을 공개한다.
월터 미베인 교수 (Walter R. Mebane, Jr)는 부정선거를 탐지하는 프로그램도 개발하여 지원하고 있으며, 최근까지 전세계 각국의 선거에서 부정의 요소들을 정확히 감지해 내는 문건을 여러차례 작성하는 등 이 분야 최고의 석학으로 꼽힌다.
Frauds in the Korea 2020 Parliamentary Election∗
Walter R. Mebane, Jr.†
April 28, 2020
The statistical model implemented in eforensics1 offers evidence that fraudulent votes occurred in the election that may have changed some election outcomes.The statistical model operationalizes the idea that “frauds” occur when one party gains votes by a combination of manufacturing votes from abstentions and stealing votes from opposing parties.
The Bayesian specification2 allows posterior means and credible intervals for counts of “fraudulent” votes to be determined both for the entire election and for observed individual aggregation units. It is important to keep in mind that “frauds” according to the eforensics model may or may not be results of malfeasance and bad actions.
How much estimated “frauds” may be produced by normal political activity, and in particular by strategic behavior, is an open question that is the focus of current research. Statistical findings such as are reported here should be followed up with additional information and further investigation into what happened.
The statistical findings alone cannot stand as definitive evidence about what happened in an election.
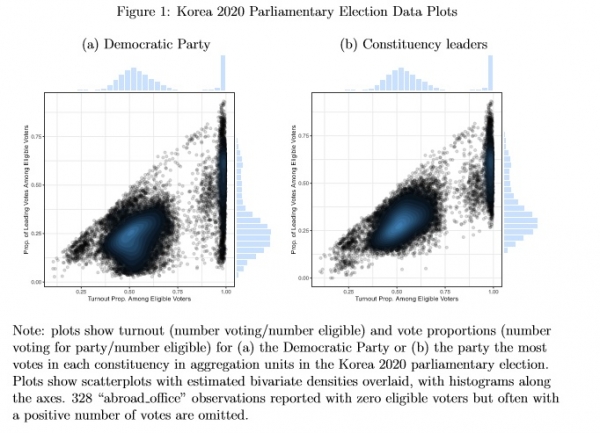
Figure 1 shows the distribution of turnout and vote proportions across aggregation units.3 Each turnout proportion is (Number Valid)/(Number Eligible), and each vote proportion is (Number Voting for Party)/(Number Eligible).
The data include counts for n = 19072 units. 328 “abroad office” observations have zero eligible voters but often a small number of votes—the largest number is 23—and are omitted from the plots.
Figure 1(a)uses vote proportions defined based on Democratic Party votes, and Figure 1(b) uses vote proportions defined based on the votes received by the party with the most votes in each constituency.
Fraud allegations have focused on the Democratic Party, but a principled way to analyze the single-member district election data is to consider that frauds potentially benefited the eading candidate in each constituency.
In the the figure differences between the two distributions are apparent, but both share a distinctive multimodal pattern. There appear to be clusters of observations that hared istinctive levels of turnout and votes, some with low, medium, high and very high turnout.
The diagonal edge feature in the plots results from using Number Eligible as the denominator for both proportions: when the party receives nearly all the valid votes, then the observation is near that diagonal.
Figure 1: Korea 2020 Parliamentary Election Data Plots
(a) Democratic Party (b) Constituency leaders
Figures 2 and 3 show that the different clusters in Figure 1 correspond with observations that are administratively distinctive.
Figure 2 displays data for Democratic Party votes, and Figure 3 shows data for constituency leader votes. The four sets of units2 that have distinctive distributions are district-level, election-day units that are not abroad (Figures 2(a) and 3(a)), postal, election-day units (Figures 2(b) and 3(b)), abroad units (Figures 2(c) and 3(c)) and pre-vote units (Figures 2(d) and 3(d)). Each subset of units (a), (b) and (d) has a mostly unimodal distribution: the marginal histograms are mostly near symmetric. But exceptional points are evident in each of these subsets. Abroad units are more distinctively bimodal when constituency leaders are considered than when the Democratic Party is in focus.
Figure 2: Korea 2020 Parliamentary Election Data Plots, Democratic Party
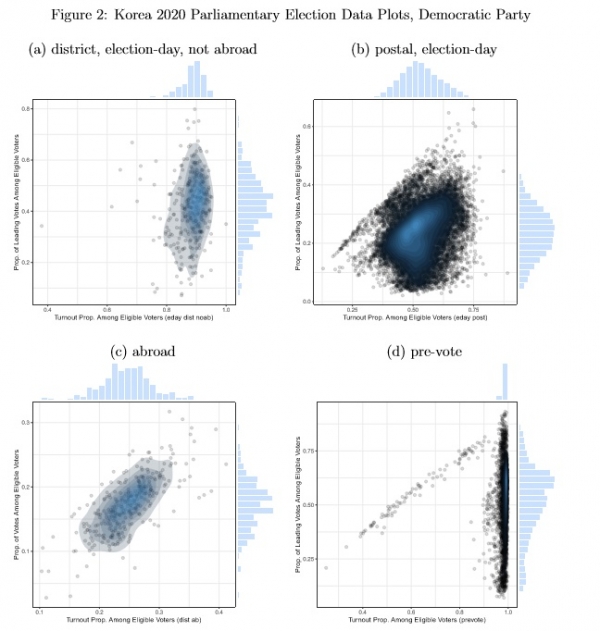
Note: plots show turnout (number voting/number eligible) and vote proportions (number voting for Democratic party/number eligible) for four subsets of observations: (a) district-level, election-day, not abroad; (b) postal election-day; (c) abroad; (d) pre-vote. Plots show scatterplots with estimated bivariate densities overlaid, with histograms along the axes. 328 “abroad office” observations reported with zero eligible voters but often with a positive number of votes are omitted.
Figure 3: Korea 2020 Parliamentary Election Data Plots, Constituency Leaders
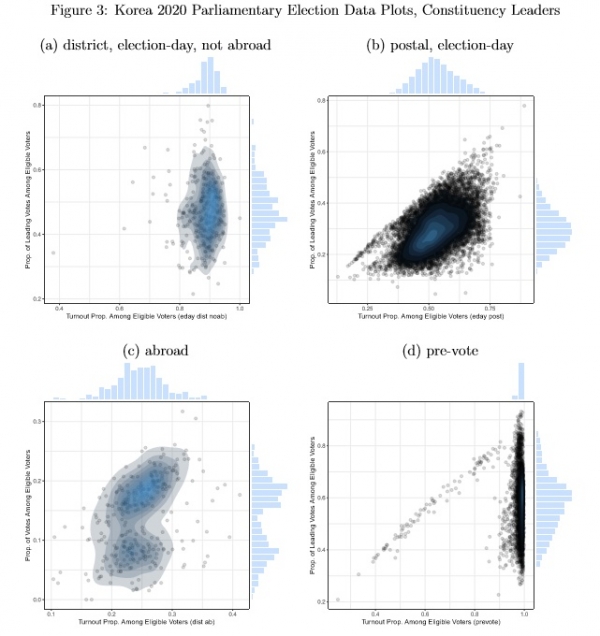
Note: plots show turnout (number voting/number eligible) and vote proportions (number voting for constituency-leading party/number eligible) for four subsets of observations: (a) district-level, election-day, not abroad; (b) postal election-day; (c) abroad; (d) pre-vote. Plots show scatterplots with estimated bivariate densities overlaid, with histograms along the axes. 328 “abroad office” observations reported with zero eligible voters but often with a positive number of votes are omitted.
I estimate the eforensics model separately for the two definitions of leading party votes. Covariates for turnout and vote choice include indicators for pre-vote, postal, abroad and disabled-ship status and fixed effects for the 252 constituencies included in the data.
The two specifications agree that 418 aggregation units are fraudulent, but 869 additional units are fraudulent in the Democratic party specification and 745 additional units are fraudulent in the constituency-leading party specification. As Table 1 shows, key parameter estimates are similar in the models. Parameters for the probabilities of frauds (π1, π2, π3) are about the same between specifications, and coefficients for the turnout equation (τ1–τ5) are similar. Coefficients for vote choice (β1–β4) differ, reflecting the differences in vote proportions being modeled.
Figure 4 uses plots by subset of Democratic party focused observations to illustrate which observations are fraudulent according to the eforensics model with the Democratic party focused specification. Nonfraudulent observations are plotted in blue and fraudulent observations appear in red. The frequencies of fraudulent and not fraudulent units appear in the note at the bottom of the figure. Visually and by the numbers, frauds occur most frequently for pre-vote units (43.1% are fraudulent), next most frequently for for district-level, election-day, not abroad unts (3.14% fraudulent) then next most frequently postal election day units (.925% are fraudulent). None of the abroad units are fraudulent.
Figure 5 uses plots by subset of constituency-leader focused observations to illustrate which observations are fraudulent according to the eforensics model with the constituency-leader focused specification. Nonfraudulent observations are plotted in blue and fraudulent observations appear in red. The frequencies of fraudulent and not fraudulent units appear in the note at the bottom of the figure. Visually and by the numbers, frauds occur most frequently for pre-vote units (22.6% are fraudulent), next most frequently for postal election day units (2.09% are fraudulent) then next most frequently for district-level, election-day, not abroad unts (.920% fraudulent). None of the abroad units are fraudulent.
Table 1: Korea 2020 Parliamentary eforensics Estimates
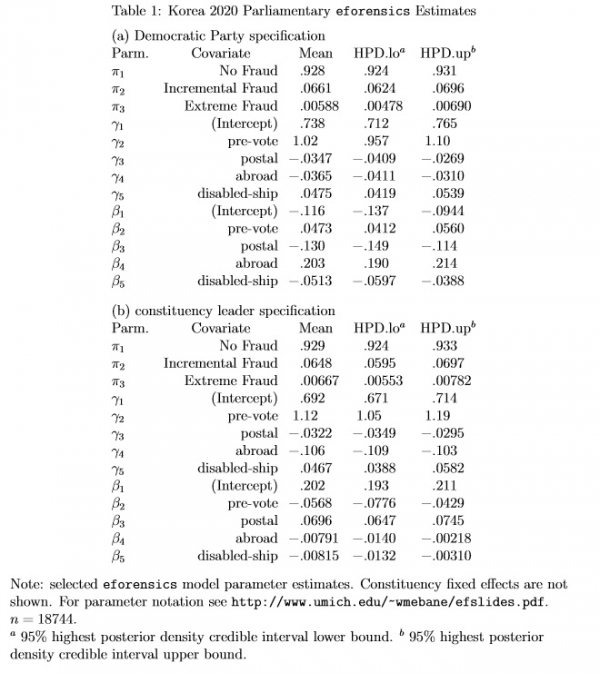
Figure 4: Korea 2020 Fraud Plots , Democratic Party
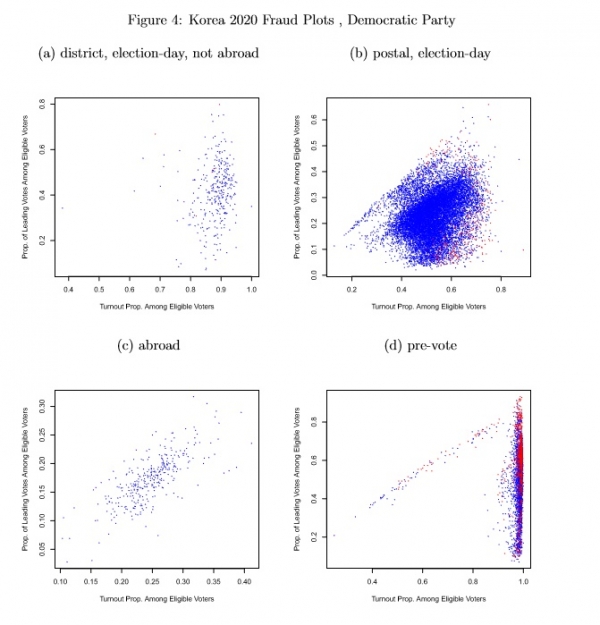
Note: plots show turnout (number voting/number eligible) and vote proportions (number voting for Democratic Party/number eligible) for four subsets of observations: (a) district-level, election-day, not abroad (10 fraudulent, 318 not); (b) postal election-day (131 fraudulent, 14155 not); (c) abroad (0 fraudulent, 328 not); (d) pre-vote (1146 fraudulent, 2656 not). Plots show scatterplots with nonfraudulent observations in blue and fraudulent observations in red. 328 “abroad office” observations reported with zero eligible voters but often with a positive number of votes are omitted.
Figure 5: Korea 2020 Fraud Plots , Constituency Leaders
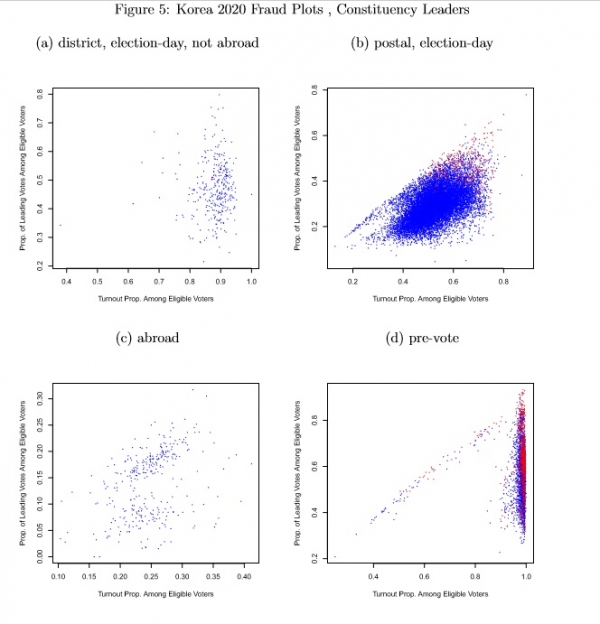
Note: plots show turnout (number voting/number eligible) and vote proportions (number voting for constituency-leading party/number eligible) for four subsets of observations: (a) district-level, election-day, not abroad (5 fraudulent, 323 not); (b) postal election-day (298 fraudulent, 13988 not); (c) abroad (0 fraudulent, 328 not); (d) pre-vote (860 fraudulent, 2942 not). Plots show scatterplots with nonfraudulent observations in blue and fraudulent observations in red. 328 “abroad office” observations reported with zero eligible voters but often with a positive number of votes are omitted.
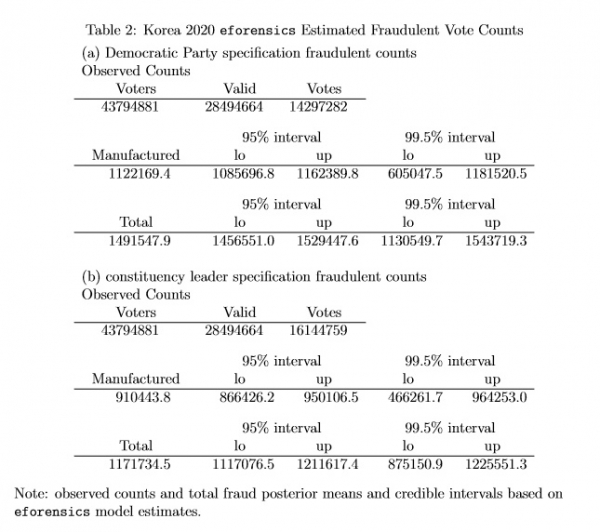
I use a counterfactual method to calculate how many votes are fraudulent.4 Table 2 reports the observed counts of eligible voters, valid votes and votes for the (a) Democratic party and (b) constituency-leading party totaled over all units in the analysis, along with fraudulent vote count totals. The total of “manufactured” votes is reported separately from the total number of fraudulent votes: manufactured votes are votes that the model estimates should have been abstentions but instead were observed as votes for the leading party.
Both posterior means and 95% and 99.5% credible intervals are reported. The results show that for the Democratic Party focused specification over all about 1,491,548 votes are fraudulent, and of the fraudulent votes about 1,122,169 are manufactured (the remaining 369379 are stolen—counted for the leading party when they should have been counted for a different party).
Overall, according to the eforensics model, about 10.43% of the votes for the Democratic Party candidates are fraudulent. The results show that for the constituency-leading focused specification over all about 1,171,734 votes are fraudulent, and of the fraudulent votes about 910,444 are manufactured (the remaining 261,290 are stolen—counted for the leading party when they should have been counted for a different party). Overall, according to the eforensics model, about 7.26% of the votes for the constituency-leading candidates are fraudulent.
Fraudulent vote occurrence varies over constituencies.
Counts of frauds by aggregation unit appear in a supplemental file5, but I use the unit-specific fraudulent vote counts from the constituency-leader focused specification to assess whether the number of fraudulent votes is ever large enough apparently to change the winner of a constituency contest. For 236 constituencies it is not, but for 16 constituencies the number of fraudulent votes is large enough apparently to change the winner of the constituency contest. In 9 instances the apparently fraudulently winning party is the Democratic Party, in 6 instances it is the United Future Party and in the remaining instance it is an Independent candidate.
Given two specifications, which one is better?
Probably neither model is correct, strictly speaking, ven beyond the generality that no model is ever correct, but some are useful. If frauds only ever benefit the Democratic Party, then those frauds may have induced apparent frauds when we constrain frauds to benefit only constituency-leading candidates, because many of these do not affiliate with the Democratic Party.
Table 2: Korea 2020 eforensics Estimated Fraudulent Vote Counts
Similarly if only constituency-leading candidates benefit from frauds, then eforensics may be producing misleading results when we constrain frauds to benefit only the Democratic Party. Or perhaps other candidates—or several in each constituency—benefit from frauds and both specifications are producing misleading results. Possibly, of course, there are no frauds and something else is going on.
Caveats are many. The most basic caution is to keep in mind that “frauds” according to the eforensics model may or may not be results of malfeasance and bad actions.
If some normal political situation makes the apparently fraudulent aggregation units appear fraudulent to the eforensics model and estimation procedure, then the frauds estimates may be signaling that “frauds” occur where in fact something else is happening. In particular there maybe something benign that leads many of the pre-vote units to have a turnout and vote choice distribution that differs so much especially from the distribution for election-day postal units, the latter comprising the bulk of the data.
Likewise something benign may distinguish the election-day postal units that the eforensics model identifies as fraudulent.
Beyond that general caution, there may something about the particular data used for the analysis that triggers the “fraud” findings—for instance, the data appear to be missing about 100,000 votes and one entire constituency, and the vote totals in the data for constituency-leading candidates do not always match totals reported in “lists of winners.”
And there may be something about the model specification that should be improved that would produce different results.
Statistical findings such as are reported here should be followed up with additional information and further investigation into what happened. The statistical findings alone cannot stand as definitive evidence about what happened in the election.
--------------------------------------------------
References
Ferrari, Diogo, Kevin McAlister and Walter R. Mebane, Jr. 2018. “Developments in Positive
Empirical Models of Election Frauds: Dimensions and Decisions.” Presented at the 2018
Summer Meeting of the Political Methodology Society, Provo, UT, July 16–18. (문건 끝)
Software Available for Downloading, with Documentation
Election Forensics R Package (eforensics tarball) and (eforensics GitHub). Diogo Ferrari, Kevin McAlister, Walter Mebane and Patrick Wu, 2019.
Robust Estimation Software (multinomRob). Walter R. Mebane, Jr., and Jasjeet S. Sekhon, 2003.
Genetic Optimization Using Derivatives for R (RGENOUD). Walter R. Mebane, Jr., and Jasjeet S. Sekhon, 2001. (The ancestral GENOUD C program from 1997 is here.)
Genetic Optimization and Bootstrapping of Linear Structures (GENBLIS). Walter R. Mebane, Jr., and Jasjeet S. Sekhon, 1998.
Papers Available for Downloading
Walter R. Mebane, Jr. 2020. `` Frauds in the Korea 2020 Parliamentary Election''
Walter R. Mebane, Jr. 2019. `` Evidence Against Fraudulent Votes Being Decisive in the Bolivia 2019 Election''
Walter R. Mebane, Jr. 2019. `` eforensics: A Bayesian Implementation of A Positive Empirical Model of Election Frauds''
Patrick Y. Wu, Walter R. Mebane, Jr., Logan Woods, Joseph Klaver, and Preston Due. 2019. `` Partisan Associations of Twitter Users Based on Their Self-descriptions and Word Embeddings'' Prepared for presentation at the 2018 Annual Meeting of the American Political Science Association, Washington, DC, Aug 29--Sep 1. 외 다수
후원하기
- 정기후원
- 일반 후원
- ARS 후원하기 1877-0583
- 무통장입금: 국민은행 917701-01-120396 (주)메이벅스
- 후원금은 CNN, 뉴욕타임즈, AP통신보다 공정하고
영향력있는 미디어가 되는데 소중히 쓰겠습니다.
Fn투데이는 여러분의 후원금을 귀하게 쓰겠습니다.